
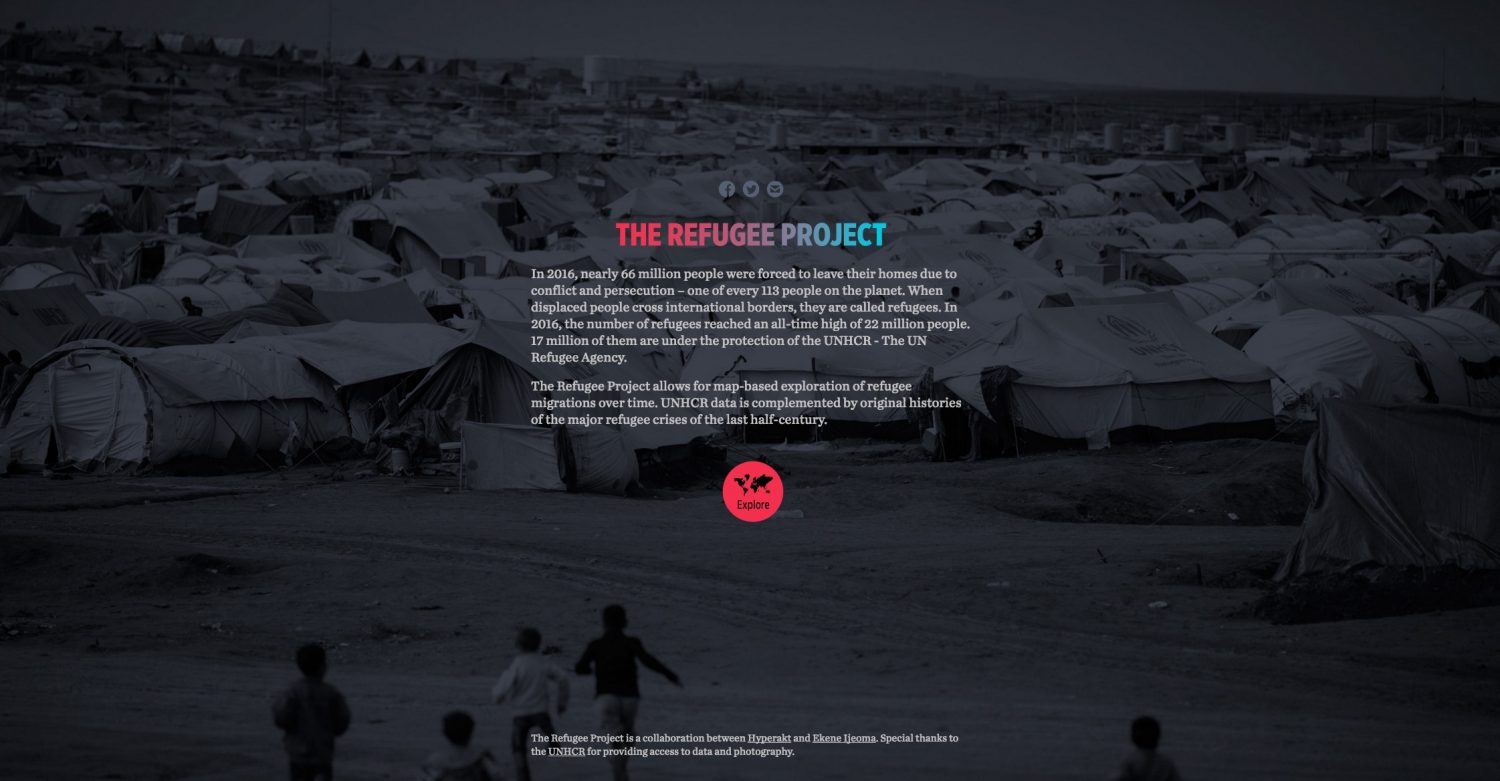
Data visualizations are cool. This map will likely interest you if you care about people or you are alive today trying to figure out what the world even is. Something is happening around the planet. It’s happening just about everywhere people live, and at an increasing pace. The map below was provided by The Refugee Project, a collaboration between Hyperakt and Ekene Ijeoma, using UNHCR data and photography. Simply press the red dot at the center (the one that says explore) to explore this unique data visualization.
The Refugee Project
Over 5 million people have left Syria. Another 2.5 million have departed Afghanistan, a country that I visited over a decade ago, where Coalition Forces still remain after 15 years. That’s a long time. It’s long enough for kids to grow up and have kids.
The geo-political map that we grew up with never existed, and it is being rewritten. Entire areas once considered countries are little more than a name in a high school kid’s geography book. Here are some Geography Facts for you.
– Afghanistan shares a boarder with China, Iran, Pakistan (2 of 8 sovereign nations with nuclear weapons)
– Iraq shares a boarder with Iran, Syria, Turkey, Saudi Arabia, Kuwait
– There is no practical semblance of boarders or immigration, especially in War Zones of SYR, IRQ, AFG. People can simply walk, flee, or drive across the desert.
– Much of the world’s oil is in this region (Saudi, Iraq, UAE, Iran, Kuwait)
– Most of the world’s illicit poppies are grown in Afghanistan (with many recent record setting years, and more production than the rest of the world combined)
– U.S. military units have been stationed in Iraq since as early as 1991: Desert Shield, Desert Storm, Operation Norther Watch, Operation Southern Watch. We never left IRQ (nearly 30 years later at the time of this post).
So What?
Earth demographics are radically shifting, and the impact will be felt in various ways. Understanding the flow of people is part of realizing how the environment is changing, and can help in anticipating people’s needs. But also data visualizations.